

2026 Update: Meet Ninjalytics
The original guide below still shows five useful ways to build custom WooCommerce sales reports with Product Sales Report Pro. Since then, we’ve also introduced Ninjalytics, a newer BerryPress reporting platform built to make the same kind of store analysis faster to set up, easier to preview, and more useful for day-to-day decisions.
Here’s what’s new in this update:
- Two of the five reports below, Sales by State or Country and Sales by Currency, now have ready-made templates in Ninjalytics, so you can build them in a couple of clicks instead of configuring them by hand.
- The other three reports — Category, Refunds, and Quarter – still need initial setup, but Ninjalytics speeds that up with live previews, dynamic date ranges, and saved report configurations you can reuse.
- The original Product Sales Report Pro instructions below are unchanged, so if that’s what you’re using today, nothing about your existing workflow needs to change.
If you only need a specific export, the instructions below remain helpful. If you want a more visual reporting workflow, including live previews, charts, dynamic date ranges, and CSV export, plus dashboard widgets, pie charts, and XLSX/HTML export on the Pro tier, Ninjalytics is the next step. It lets you report, analyze, and visualize WooCommerce data directly inside WordPress without needing to rebuild common reports from scratch each time.
Editor’s note: We’ve updated this guide for 2026 to keep the original Product Sales Report Pro configurations intact while adding a newer Ninjalytics workflow for store owners who want faster setup, visual reporting, and saved analytics views.
Built-in WooCommerce reporting has come a long way in the past few years, thanks in large part to the Analytics admin section that was added to WooCommerce when the WooCommerce Admin plugin became part of WooCommerce core, replacing the old Reports interface. But sometimes you may want to drill down deeper into your store’s data than even the newer default reporting features allow for. For many years, our WooCommerce plugins Product Sales Report Pro and Export Order Items Pro (and their free counterparts) have been meeting the need for more advanced and highly customizable WooCommerce reporting. If you’re a Product Sales Reports Pro user, or looking to become one (both of the above plugins are included in our membership!), here are configuration instructions for five handy reports that you can generate using that plugin. Each configuration assumes you are starting out with default Product Sales Report Pro settings and have specified your desired reporting time period in the Order Filtering tab.
WooCommerce Report #1: Product Sales by State or Country
Start by setting any product filtering that you want to apply to the report. For example, you may want to see the state or country sales for a specific product or product category; if so, choose the corresponding options under Include Products in the Product Filtering tab. Alternatively, you can just leave that setting at “All products” to get a store-wide report.
Under the Order heading in the Group By 1 dropdown in the Grouping & Filtering tab, choose _shipping_country to report on sales by country, or _shipping_state to report on sales by state. If you would like to report based on the billing address instead of the shipping address, choose _billing_country or _billing_state instead.
Also in the Grouping & Filtering tab, choose “Don’t group by products or variations” from the Product Grouping dropdown. This will segment your sales data by the country or state field instead of by products and product variations. Note that this setting also affects other settings in the report; for details, see the note provided in the plugin.
You’ll probably also want to go to the Report Fields tab and drag-and-drop the country or state field to the top of the list so that it’s the left-most column, and rename it to have a more user-friendly title. Then you’re ready to run your report!
Bonus: You can also include both the country and the state in your report by selecting _shipping_country in the Group By 1 dropdown and _shipping_state in the Group By 2 dropdown!
WooCommerce Report #2: Sales by Product Category
If your WooCommerce store has a lot of products, you might want to get an overview of how those products are performing based on which category they belong to, instead of seeing the sales data for each product individually. Go to the Grouping & Sorting tab and choose “Group by product category” from the Product Grouping dropdown. Next, in the Report Fields tab, choose the Product Categories field under the Built-in Fields heading in the Add Field dropdown, and click Add. Once again, you’ll probably want to drag-and-drop this field to the start of the list (and rename it to “Product Category” since this report will list each category individually).
Bear in mind that sales for a product may be included under more than one category if the product is assigned to multiple categories, so the total of the rows in the report may be greater than the actual total sales over the reporting period.
WooCommerce Report #3: Product Refunds
Refunds can be tricky to report on because there are two ways to issue refunds in WooCommerce, and each method results in a different representation of the refund in the shop’s database. One way is to simply change the status of the order to “Refunded”; this creates a refund but does not associate the refund with the individual product line items on the original order. The other way is to click the Refund button below the list of order items in the order editing screen, and to enter a refund that is associated with the original order’s line items. In order to report on product-specific refund data with Product Sales Report Pro, you’ll need to enter refunds via this second method, which is not exclusive of fully refunded orders also having the Refunded order status.
In order to report on refunds from all orders, start by making sure that all order statuses are selected under Include Orders With Status in the Order Filtering tab (this includes the Refunded status). Next, in the Report Fields tab, choose “Quantity Refunded” under “Built-in Fields” in the Add Field dropdown, and click Add. Repeat this process for the “Gross Amount Refunded (Excl. Tax)” field. In the current version of Product Sales Report Pro, you’ll also need to ensure that “Quantity Sold” and “Gross Sales” are included in the fields list. You can also choose to sort by the Quantity Refunded or Gross Amount Refunded field in the Grouping & Sorting tab’s Sort By setting so that you can see the most or least refunded products first, based on refund quantity or total refund amount, respectively. If you only want to focus on the top 10 or top 25 refunded products, ensure that the sort order is set to descending and also enable the Row count setting in the Display & Format tab and specify how many rows you want to show.
Don’t forget that your report’s date filtering is applied to line-item refunds based on when the refund was created, not when the original order was placed, so your refund statistics may include refunds for orders made before your reporting period start date and time.
Bonus: Combine this configuration with the Sales by Product Category configuration described above to see refund statistics by product category instead of individual products!
WooCommerce Report #4: Total Sales by Quarter
Getting a quick overview of your quarterly total sales history is easy in Product Sales Report Pro for WooCommerce. Once again, we turn to the Grouping & Sorting tab. In the Group By 1 dropdown, choose Order Year under the Order heading, and Order Quarter under the same heading in Group By 2. In the Product Grouping dropdown, choose “Don’t group by products or variations” to disable the default product-based sales segmentation. Move the Order Year and Order Quarter fields to the first and second positions in the fields list in the Report Fields tab, and you’re all set!
WooCommerce Report #5: Total Sales by Currency
If you have a multi-currency store, you may want to see what amount of your sales are made in each of the currencies you support. In the Grouping & Sorting tab, select the _order_currency field under the “Order” heading in the Group By 1 dropdown, and choose “Don’t group by products or variations” as the Product Grouping setting. Rename and re-order the _order_currency field in the Report Fields tab and run your report!
Conclusion
Product Sales Report Pro for WooCommerce is a powerful and flexible tool that allows you to go beyond what is possible in WooCommerce’s built-in reporting functionality to create advanced reports that provide valuable business insights into your store’s sales. This WooCommerce reporting plugin (as well as Export Order Items Pro for WooCommerce) is included in our memberships, and it is also available to purchase on its own. Get started running these and many other reports today!
2026 Bonus: Build These Reports Faster with Ninjalytics Pro
The five report ideas above are still practical: location-based sales, category performance, refunds, quarterly totals, and multi-currency revenue all help you understand what is really happening in your store. With Ninjalytics, you can use ready-made templates you can run in a couple of clicks. Ninjalytics makes that setup faster and easier to check, with a live preview, chart views, and saved report configurations you can reuse instead of rebuilding each time.
That makes Ninjalytics especially useful when reporting is not a one-time export, but part of how you run the business: checking category performance, watching refund trends, comparing regions, reviewing sales by currency, or preparing operational exports for bookkeeping and fulfillment.
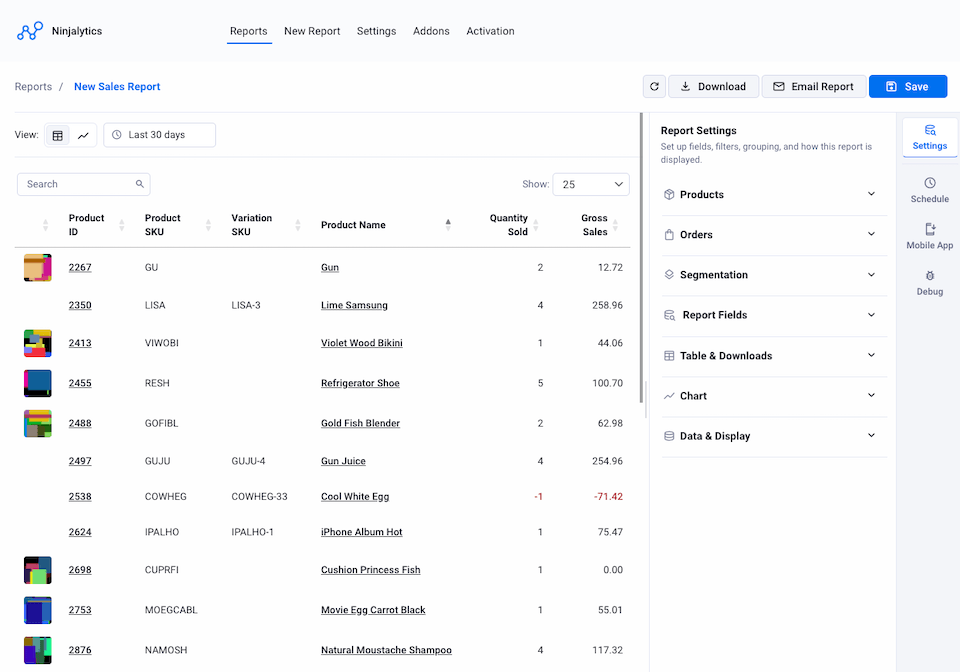
“All Sales” WooCommerce report in the Ninjalytics plugin
How Ninjalytics improves the reporting workflow
- Start with a template where one exists: sales by state/country, sales by currency, sales by product, refunds by product, refund trend, and all sales are available as ready-made starting points, so you can get results in a couple of clicks instead of configuring grouping and fields from scratch.
- Preview before exporting: live report preview helps you see whether the fields, filters, grouping, and date range are right before downloading a file.
- Use charts when a table is not enough: line and bar chart options make it easier to spot trends and outliers without manually building charts in a spreadsheet (pie charts are available with Ninjalytics Pro).
- Save repeatable reporting setups: keep the reports you use regularly instead of reconfiguring them every time, including the three report types that don’t have a built-in template yet.
- Export in practical formats: generate a CSV export on the free plan, or step up to XLSX and HTML with Ninjalytics Pro, depending on what you need to do with the file.
- Bring reports into the WordPress dashboard: with Ninjalytics Pro, dashboard widgets can pin your saved reports directly to WP-Admin, so the numbers are there the moment store managers log in.
- Analyze Live Carts: Ninjalytics also includes support for Live Carts for WooCommerce, which is helpful to track active, abandoned, and converted carts.
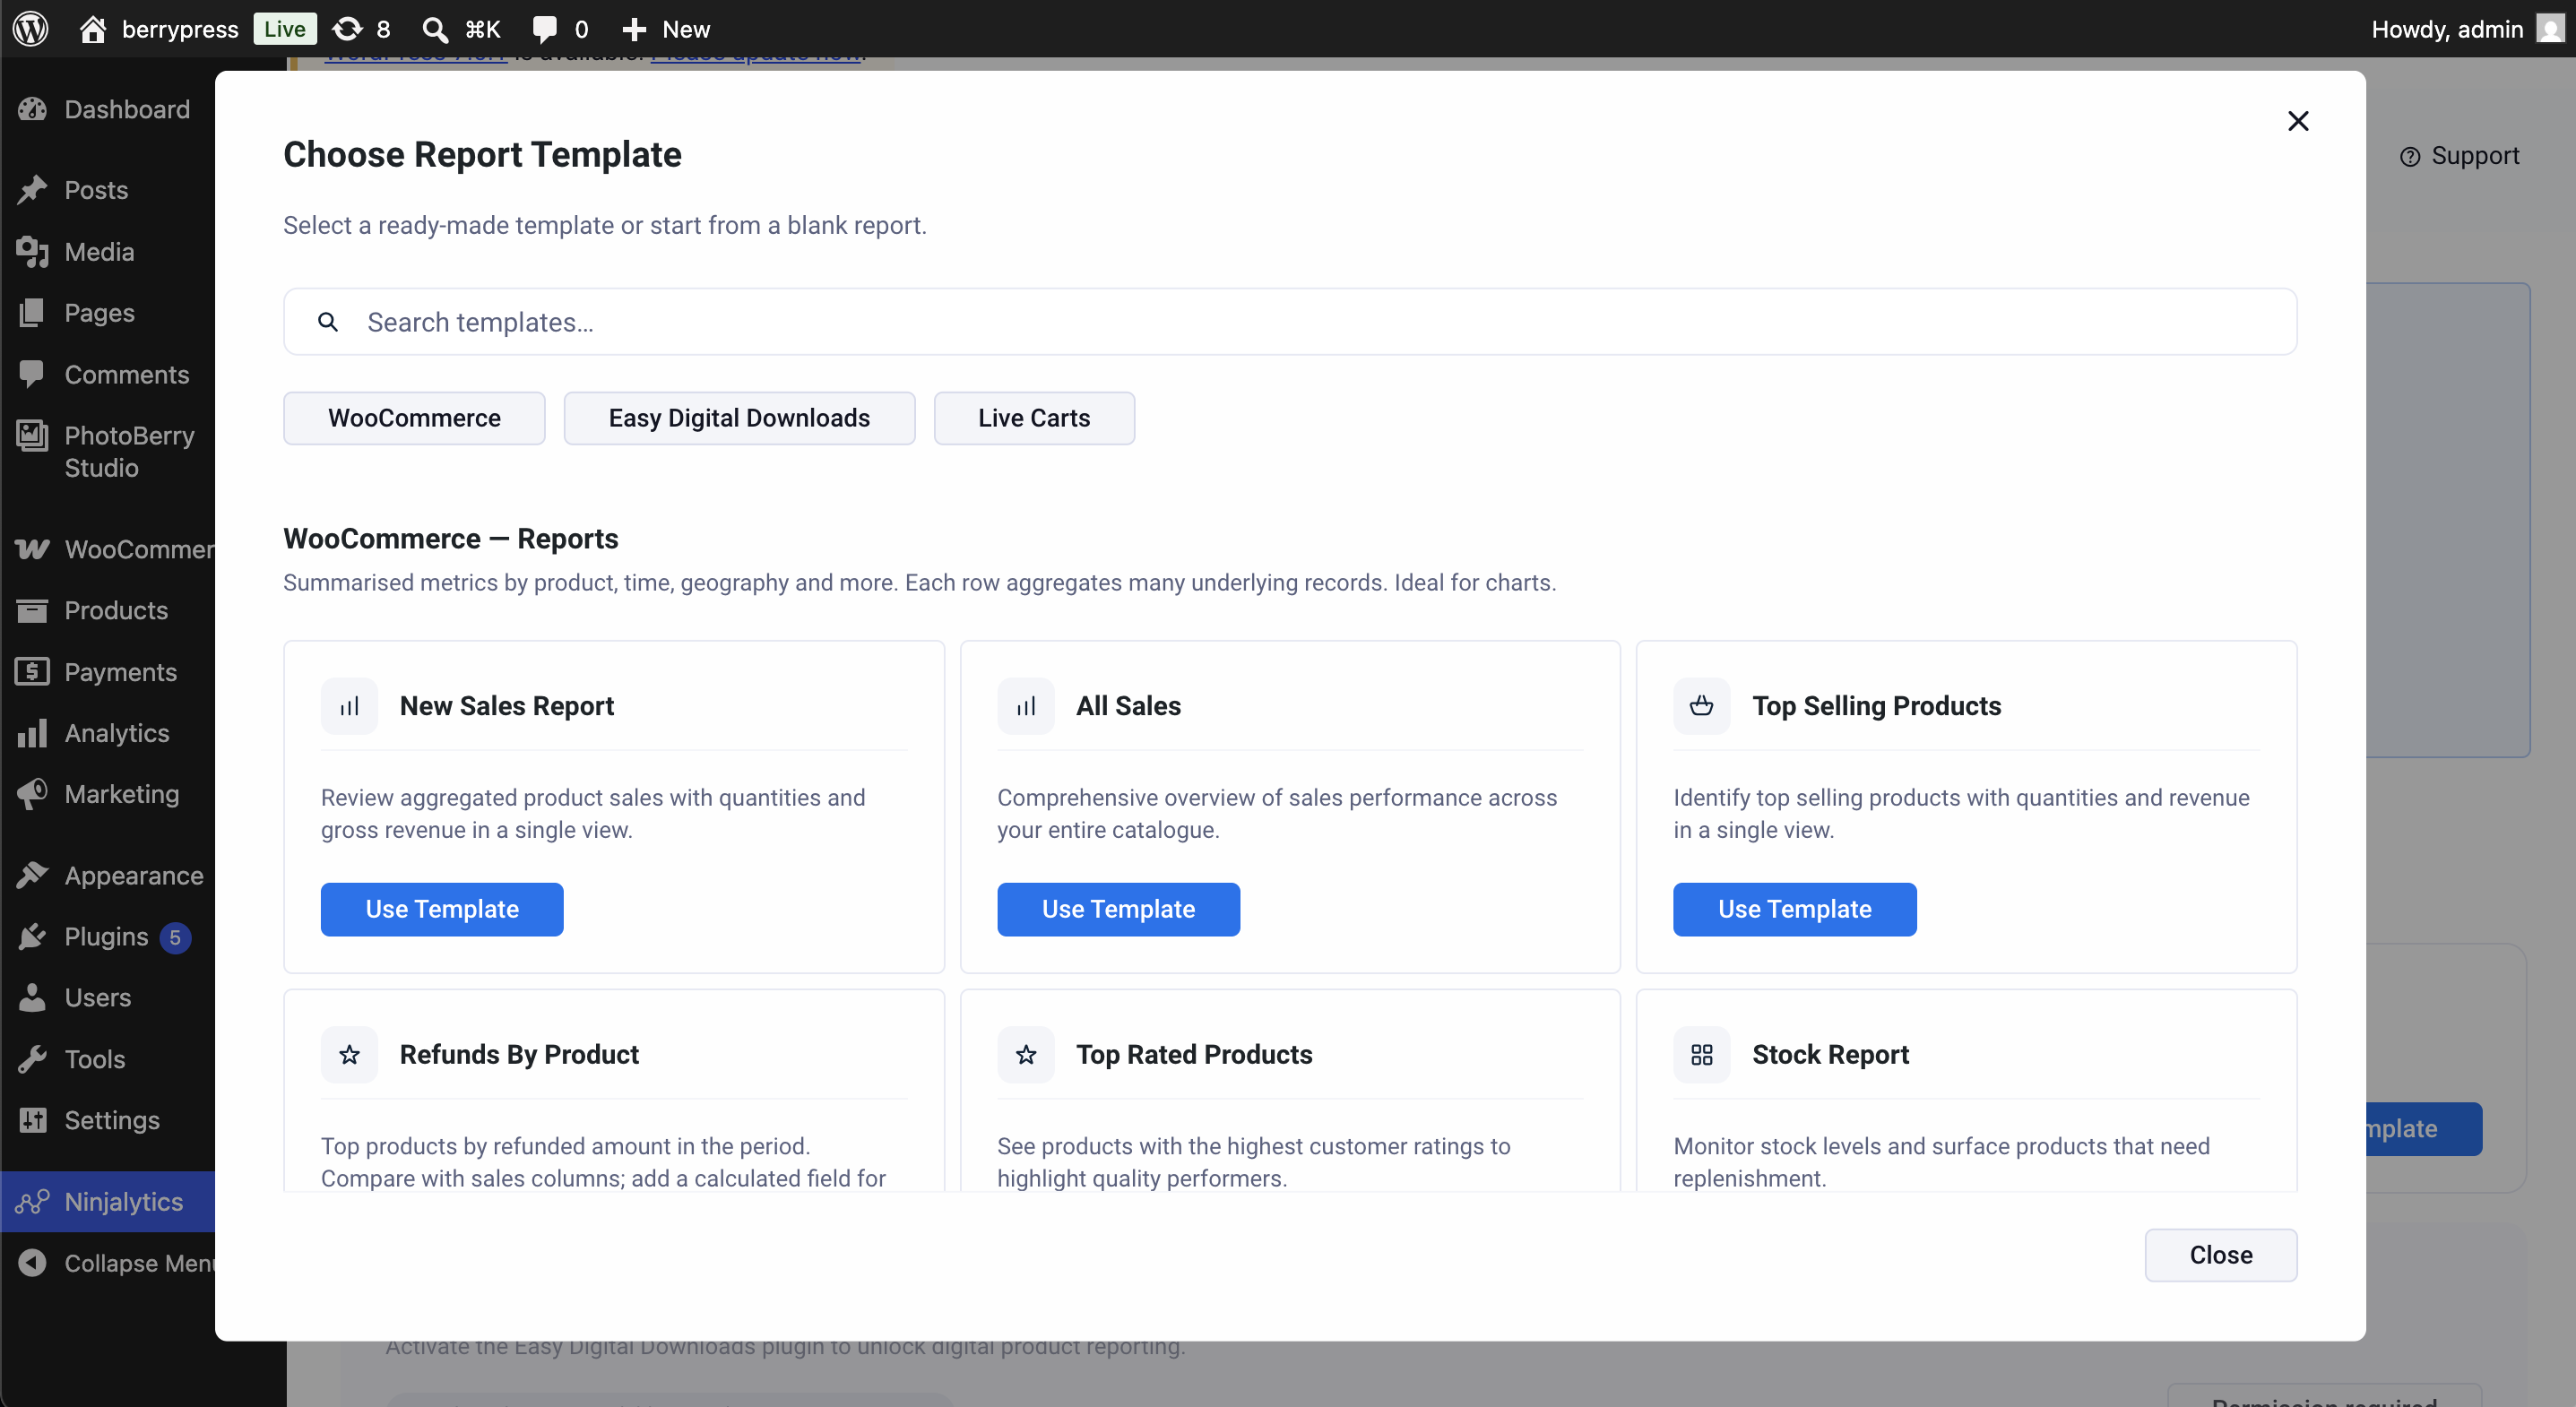
Create a report from pre-made templates library
How the five reports translate to Ninjalytics
| Report from this guide | Setup in Ninjalytics | How Ninjalytics helps |
|---|---|---|
| Product sales by state or country | Ready-made template | Pick whichever of the two templates matches your audience, or build a custom report if you need the billing-or-shipping, state-or-country flexibility described above in one view. |
| Sales by product category | Ready-made template | Use template “Sales By Product” – Add field “Product Categories” to your report and under Segmentation, enable grouping by product category |
| Product refunds | Ready-made template | Use ready template “Refunds By Product”, “Refund Trend (Monthly)”, or “Refunds & Returns”. Customize report, sorting, row limits, and visual styling to spot the products or categories that need attention. |
| Total sales by quarter | Ready-made template | Use template “All sales”. To show them by quarter, adjust the time range. You can display total row, by enabling “Show column totals”. Use dynamic date ranges and time-based grouping to review performance over longer periods without manually rebuilding the report each quarter. |
| Total sales by currency | Ready-made template | The Sales by Currency template does this natively – no custom setup required. |
Product Sales Report Pro vs. Ninjalytics
Product Sales Report Pro remains a strong option for store owners who want detailed product sales exports and are comfortable configuring reports directly. Ninjalytics is designed for a broader, more modern reporting experience: ready-made templates for location and currency reporting, a live-preview configurator for the rest, visual analysis, saved reports, and support for multiple ecommerce integrations – with dashboard widgets, pie charts, extra export formats, and a mobile app available on the Pro tier.
| Need | Product Sales Report Pro | Ninjalytics Pro |
|---|---|---|
| Custom WooCommerce product sales exports | Yes | Yes |
| Ready-made report template | Manual setup for all reports | Over 20 ready to use report templates |
| Live preview while configuring | Export-focused workflow | Live report preview |
| Charts and visual analysis | Primarily tabular reporting | Line, pie charts, and bar charts |
| Saved dashboards inside WordPress | Not the main workflow | Dashboard report widgets |
| Export formats | Useful spreadsheet/report exports | CSV, XLSX and HTML |
| Multiple ecommerce platforms | WooCommerce-focused | WooCommerce, Live Carts and Easy Digital Downloads support |
| Export details of individual orders | Not available | Yes, all features of Export Order Items Pro |
| Custom calculated fields | Not available | Define formulas for calculated fields, without using spreadsheet software. |
| Ninjalytics App (Android; iOS) | Not available | Yes, free! |
Product Sales Report Pro Plugin Settings
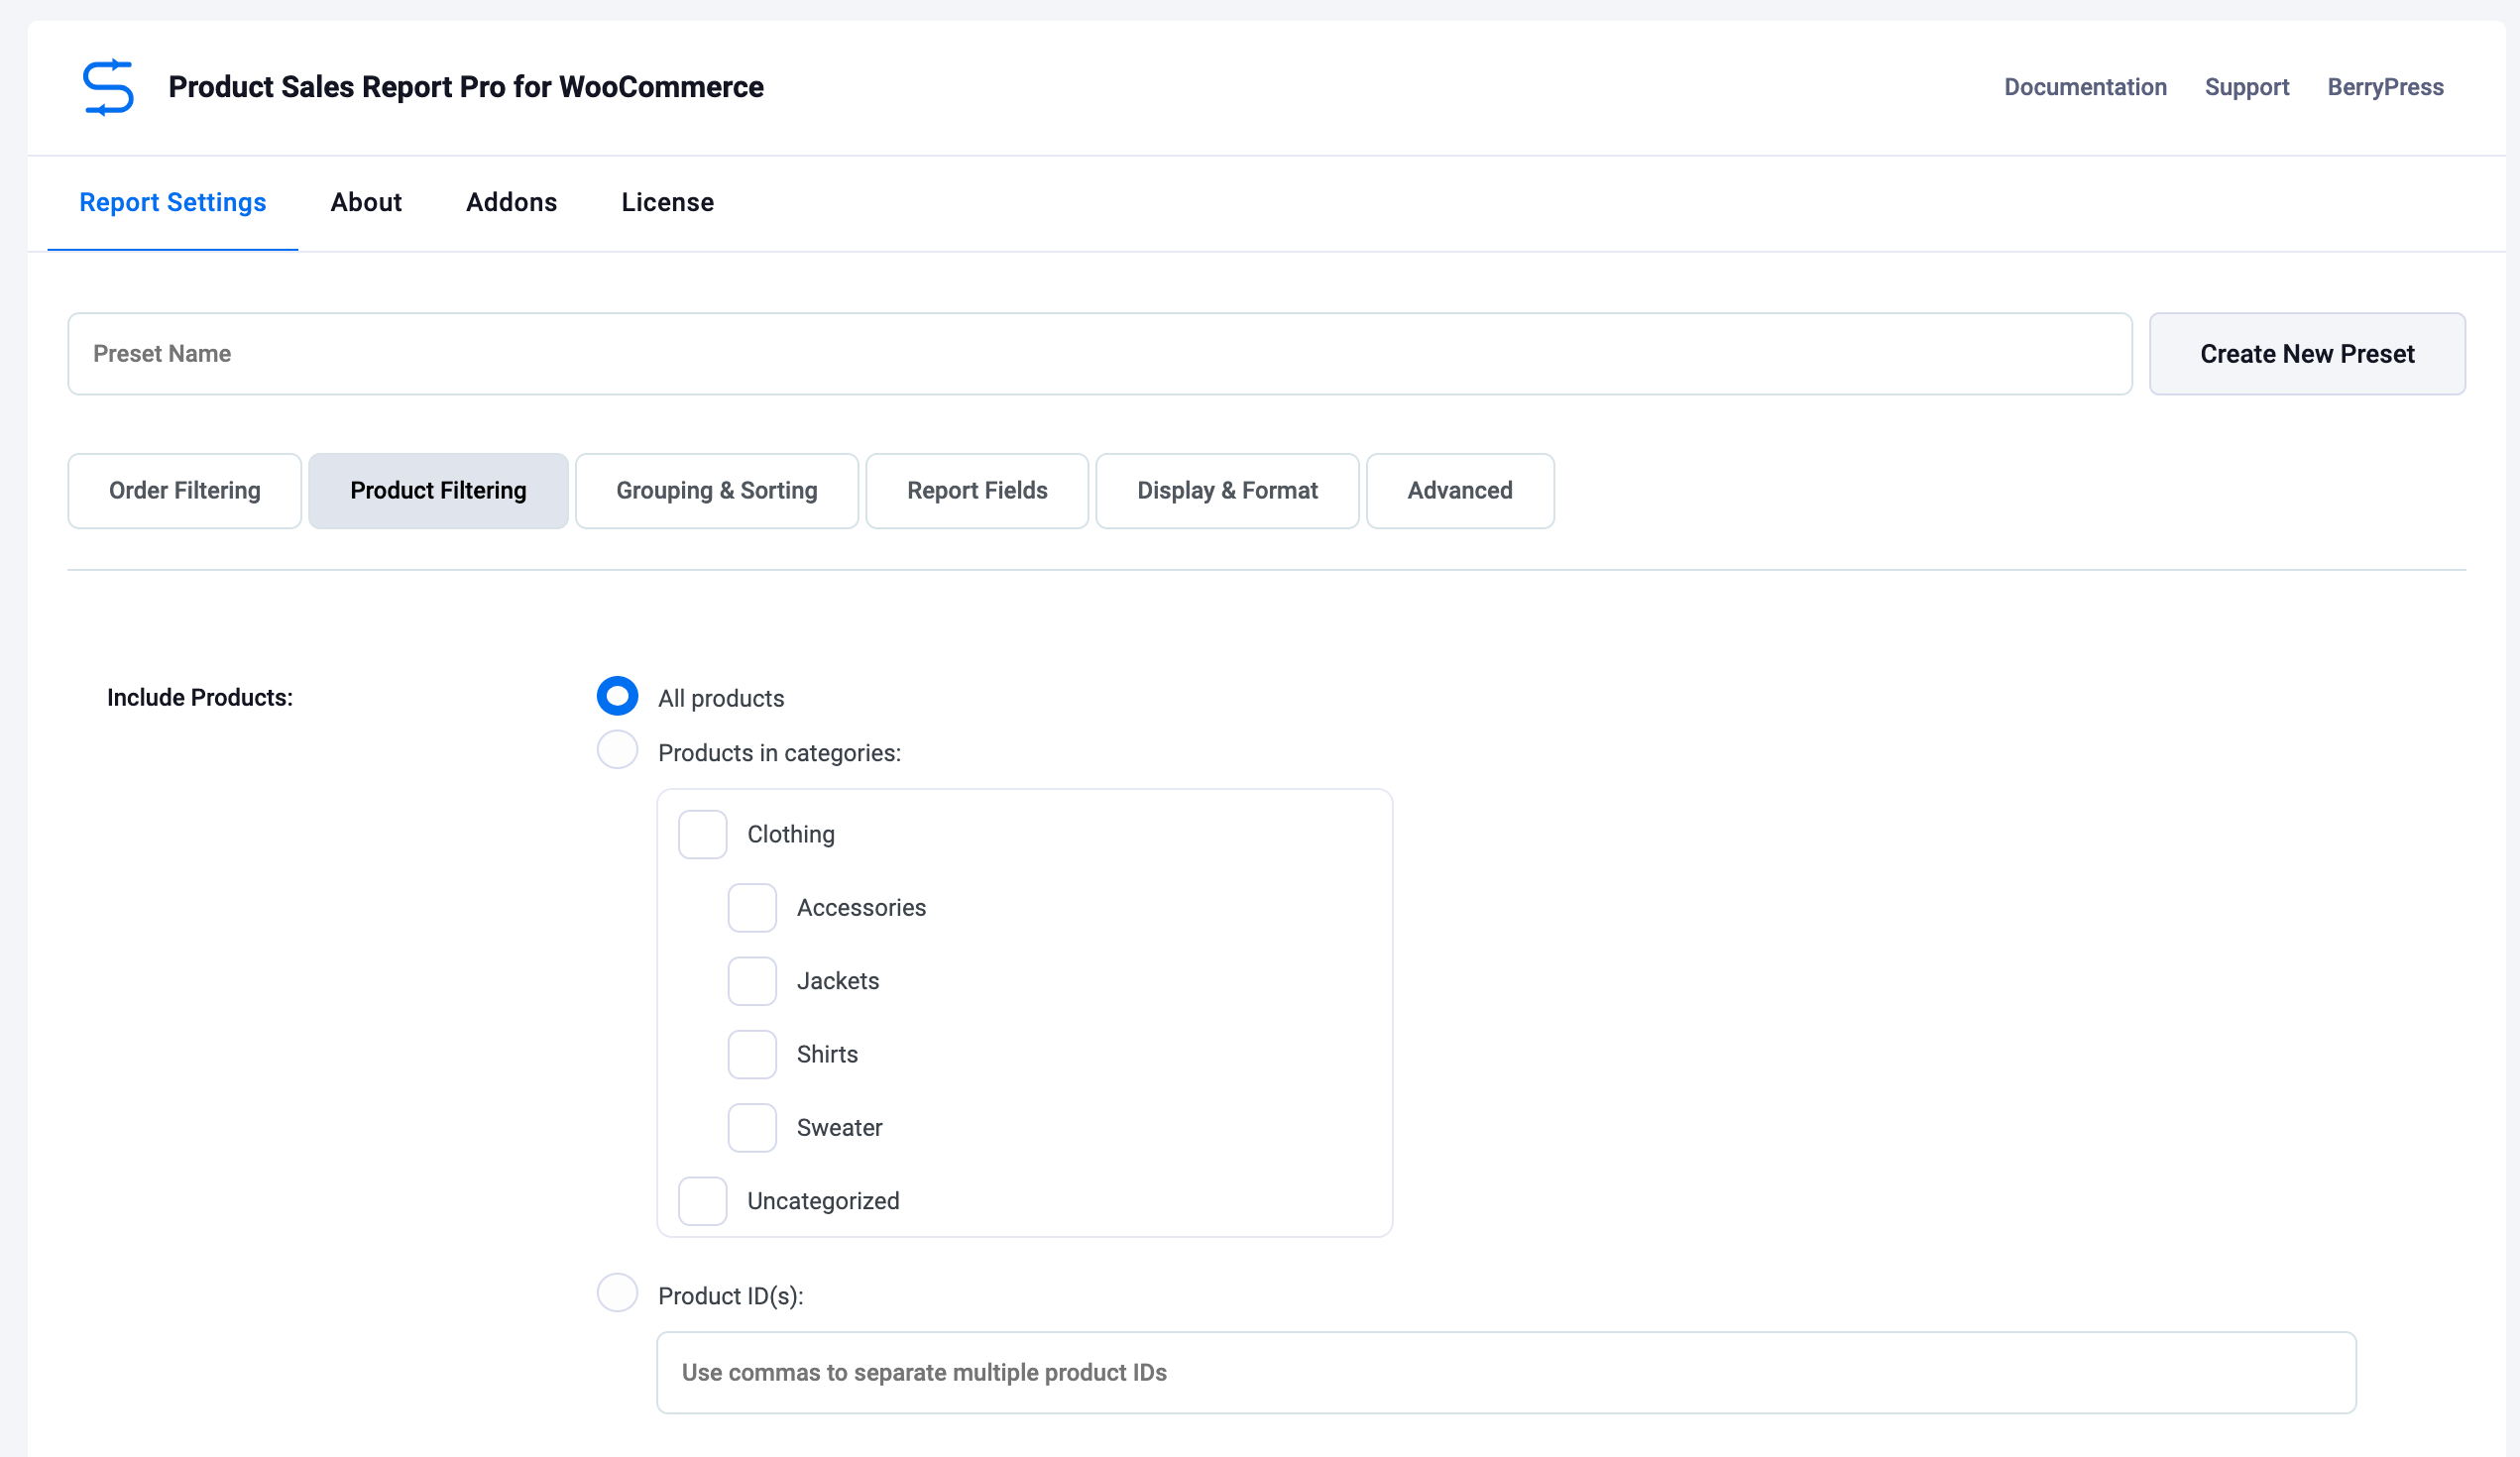
Product Sales Report Pro – creating report
Ninjalytics plugin settings:
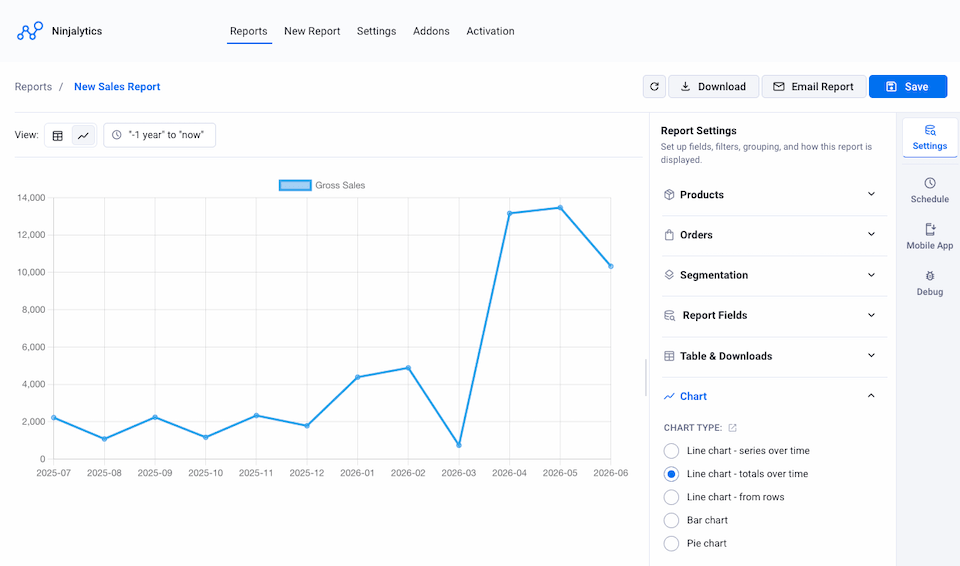
Ninjalytics – display sales as a line chart chart
Which Reporting Tool Should You Use?
Answer is simple: Ninjalytics! Use ready-made templates, a live preview before you export, or charts and saved report setups you can reuse (plus dashboard widgets and pie charts on the Pro tier).
If you came here for a specific Product Sales Report Pro configuration, the original five examples above are still worth using. But if you want faster setup, easier repeat reporting, visual analysis, and a more guided experience, Ninjalytics is the better place to start. If you already have configurations set up, all reports will be automatically imported to Ninjalytics.
Explore Ninjalytics for WooCommerce reporting and see how quickly you can turn store data into reports, charts, and actionable insights.


Recent Comments