One of the most important things you can do when managing a WooCommerce store is to pay attention to your orders. WooCommerce has several reporting tools built-in to provide information about your sales. In this beginner’s guide to WooCommerce orders reports, we’ll take a close look at those built-in reporting tools. We’ll also look at a few plugins that add even more reporting tools to improve your reports even further.
Where to Find Orders Reports
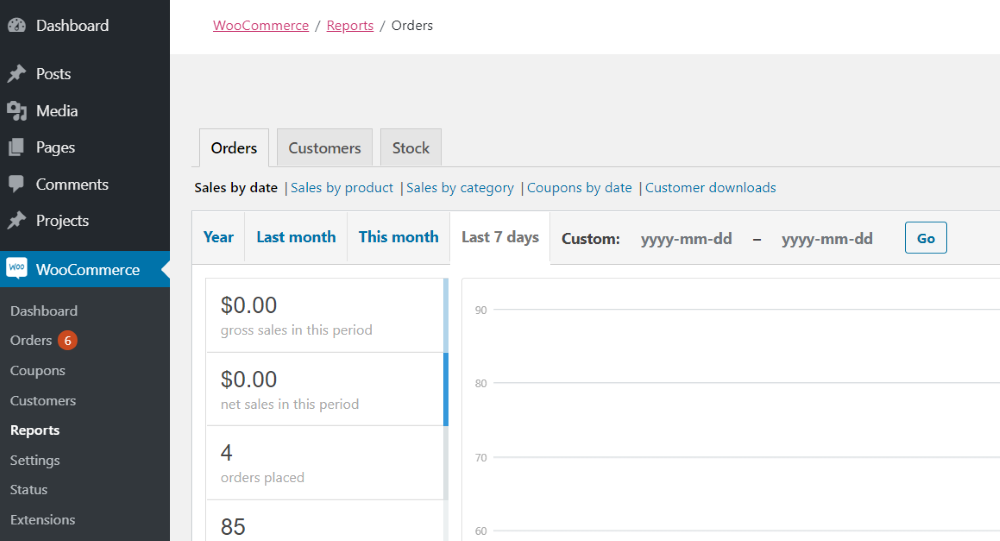
To find the Order reports, in the WordPress dashboard go to WooCommerce > Orders. Here, you find several tabs (Orders, Customers, and Stock). You’ll find the Orders reports under the Orders tab. Within the tab are links to several different types of reports. Options include:
- Sales by date
- Sales by product
- Sales by category
- Coupons by date
- Customer downloads
Most include charts that you can see by date. Choose the year, last month, this month, last 7 days, and custom. Custom opens a date picker so you can specify the date range you want to see. The default shows the last 7 days. You can export the data as a CSV file.
Note – all of the dollar values in my examples will be $0 because I didn’t pay for the sample products in my sample store. Your charts will be prettier than mine.
Let’s look at each one in detail.
Sales by Date
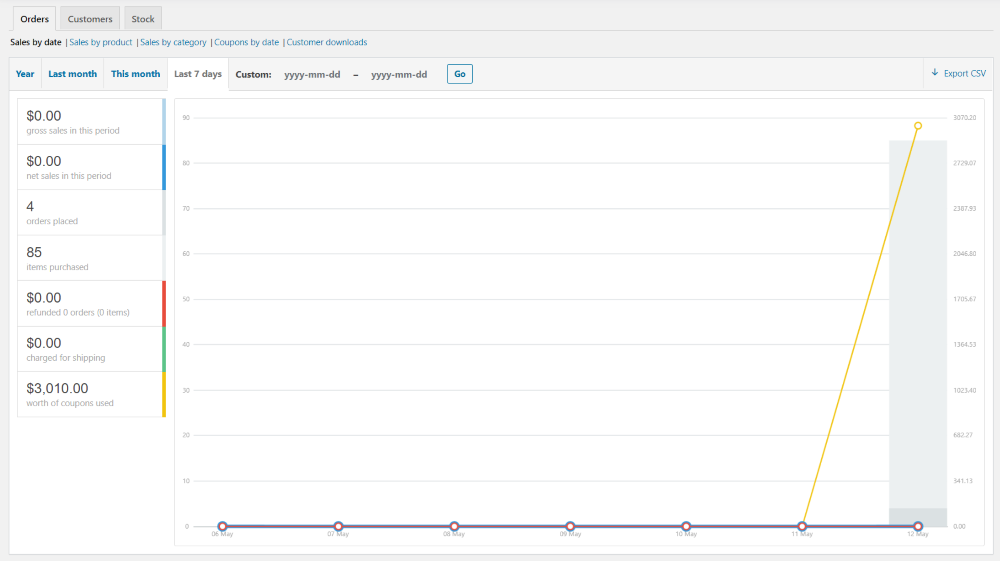
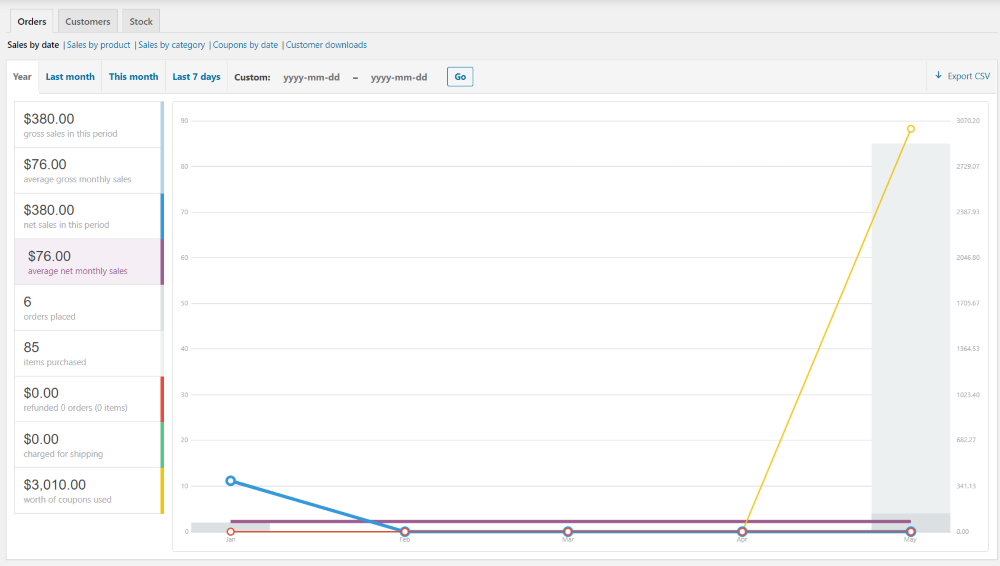
Sales by date displays a chart for your sales based on the date range that you choose or specify. On the left of the chart, you’ll see a list of data points to view. They include gross sales in this period, net sales in this period, orders placed, items purchased, amount refunded, amount charged for shipping, and the worth of coupons that were used. Each data point includes their values in the currency you’ve selected for your store.
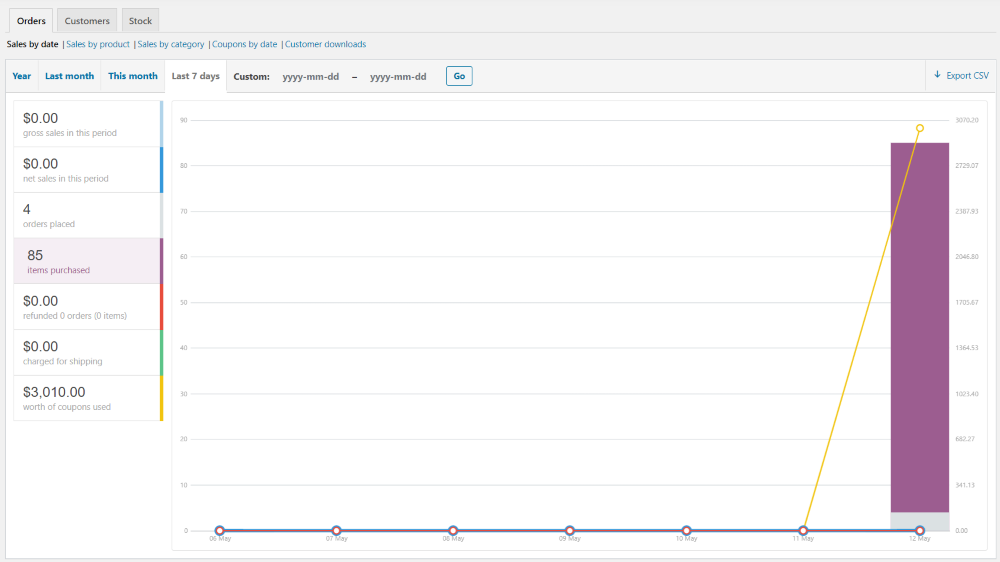
Each of the items is color-coded and they’re interactive. Hovering over them changes the chart to highlight that point. In the example above, I’m hovering over Items purchased.
For this one, I’ve selected Year and I’m hovering over Average monthly sales by year.
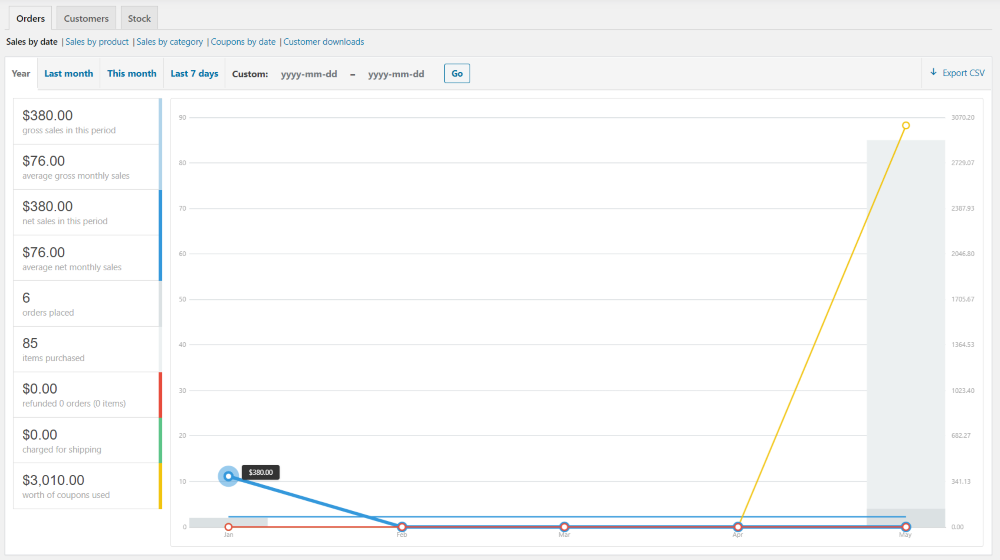
The points on the chart are also interactive. Hovering over them provides values for that date or data point.
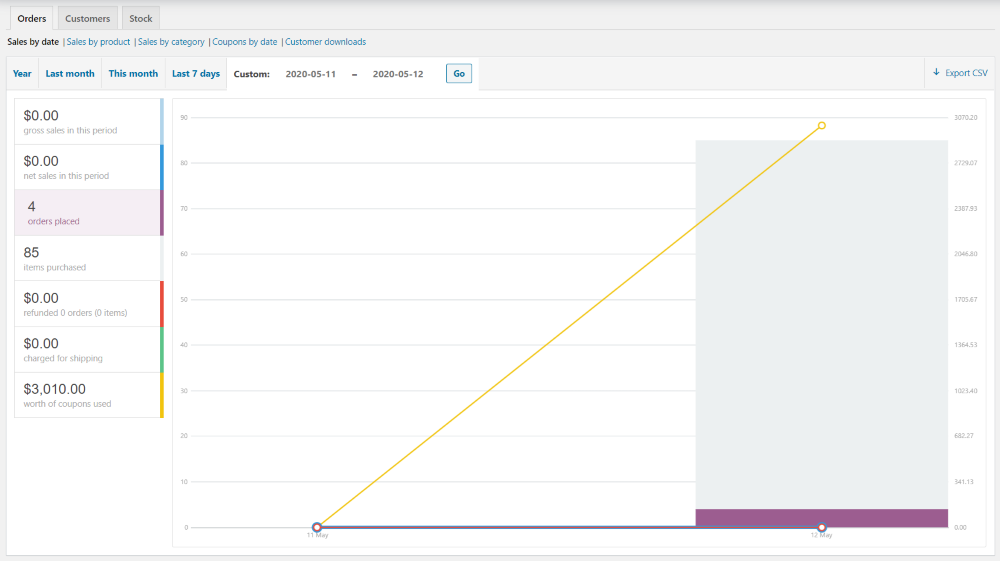
For this one, I’ve selected a custom date range of two days. I’m hovering over the number of orders placed.
Sales by Product
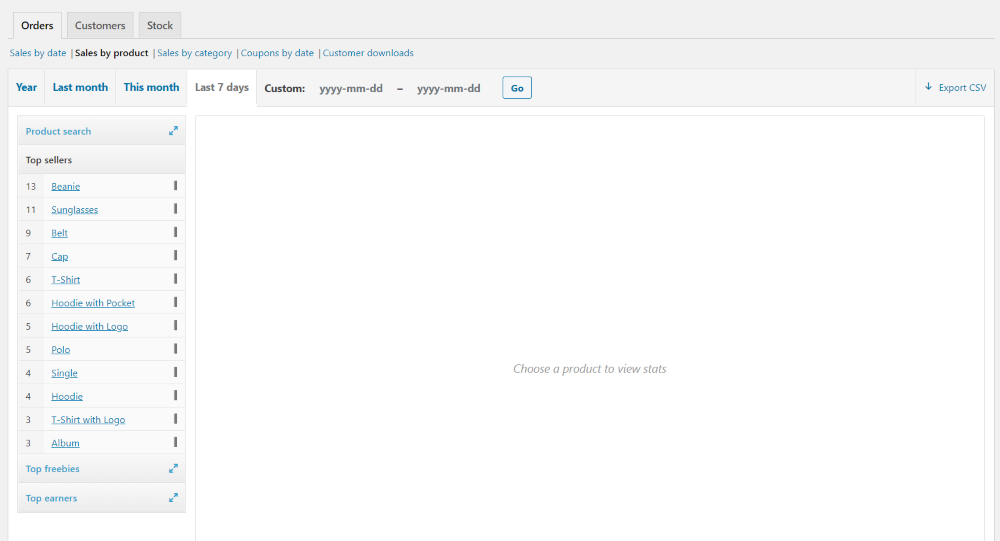
Sales by product lists the products and sorts them in several ways. Search for specific products in the product search. View products by top sellers, top freebies, and top earners. The top sellers list is the default view. It sorts them by the most to the least in sales.
Top Sellers

Selecting a product displays the information on the chart. It shows the value of sales and the number of sales.
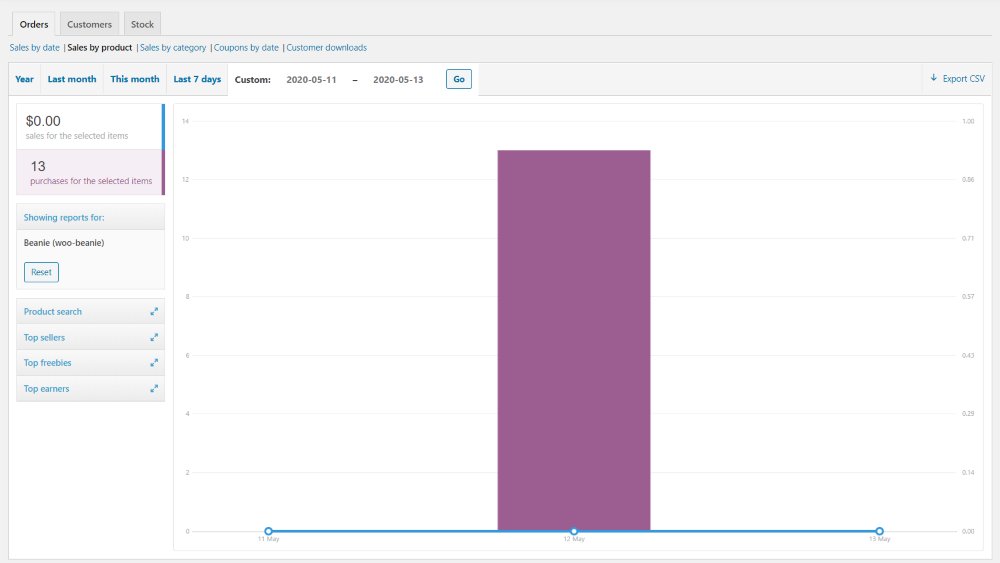
This chart is also interactive, so you can highlight each of the data points and dates to see specific information. I’ve selected a date-range and highlighted the number of sales. Clicking Reset clears the chart (except for the date-range) and lets you make another selection. Top freebies and Top earners work the same.
Product Search
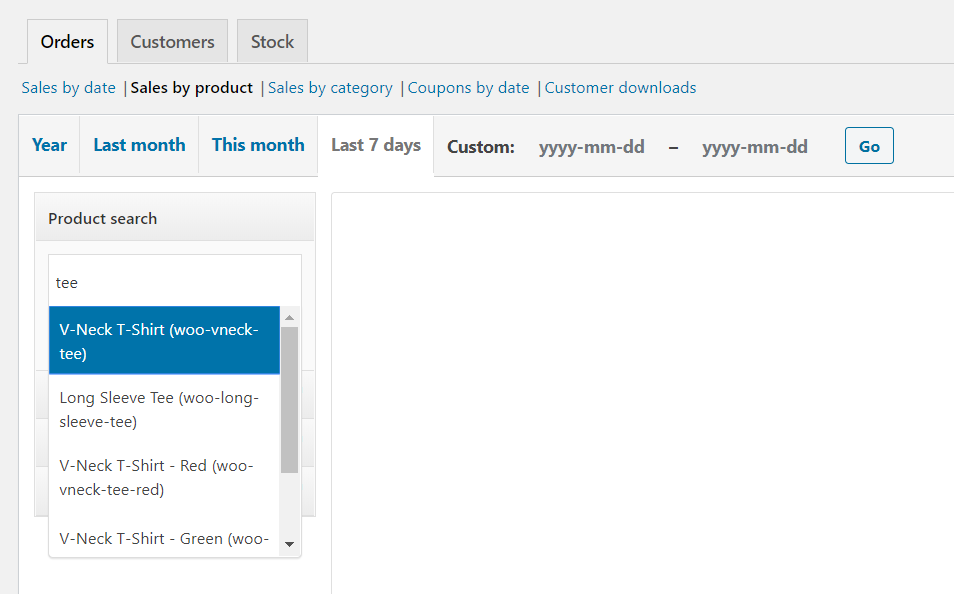
To search, simply enter the name of the product you’re looking for. If there are multiple products, you can select the one you want from the list.
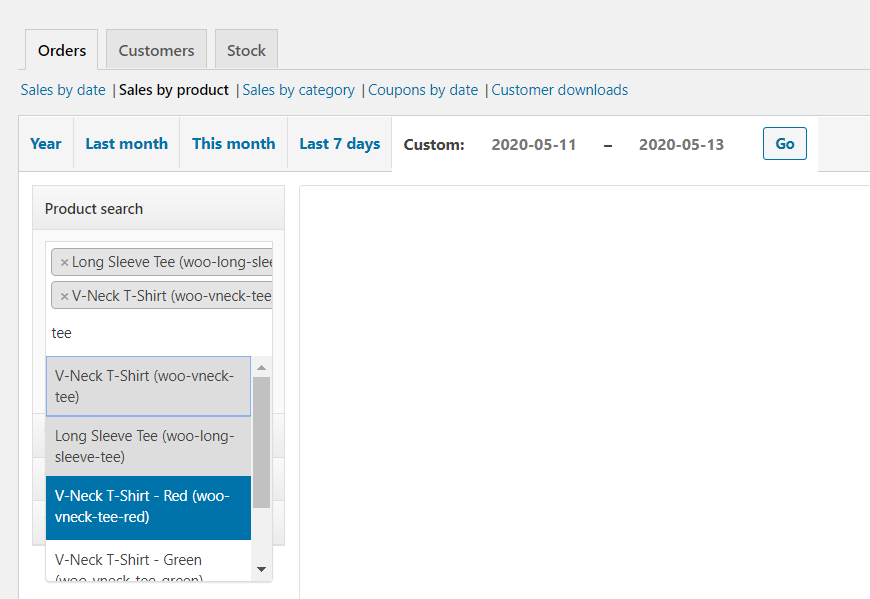
You can select multiple items by searching again. When you’re done, click Show to see the chart.
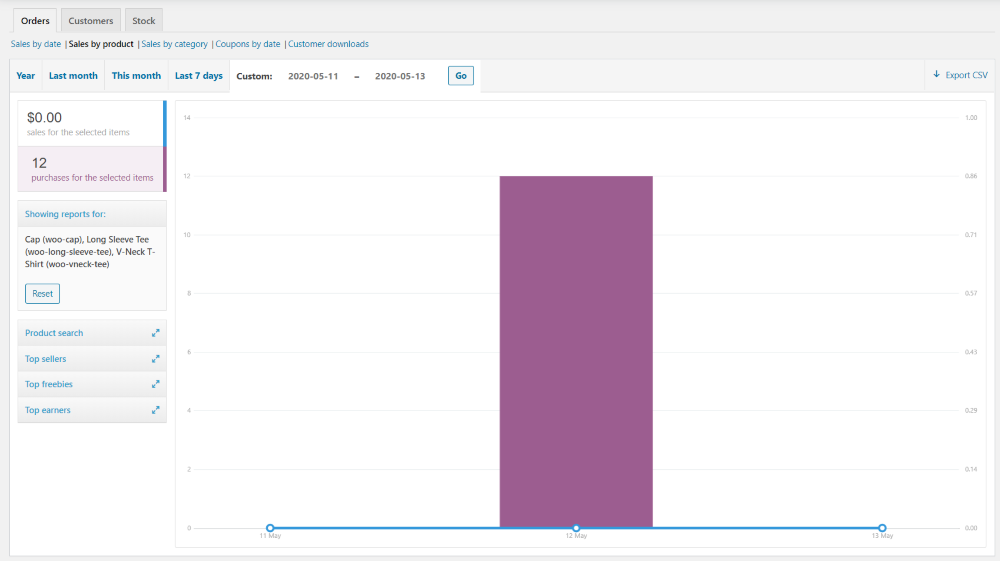
Here’s the chart for three different products. The focus is on the total number of sales.
Sales by Category
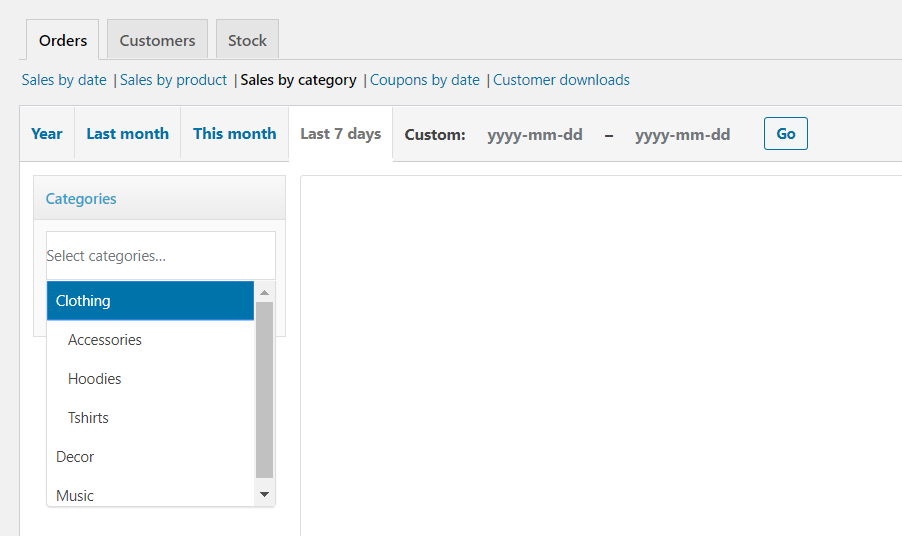
Sales by category provides a dropdown box that displays a list of your categories when you click on it.
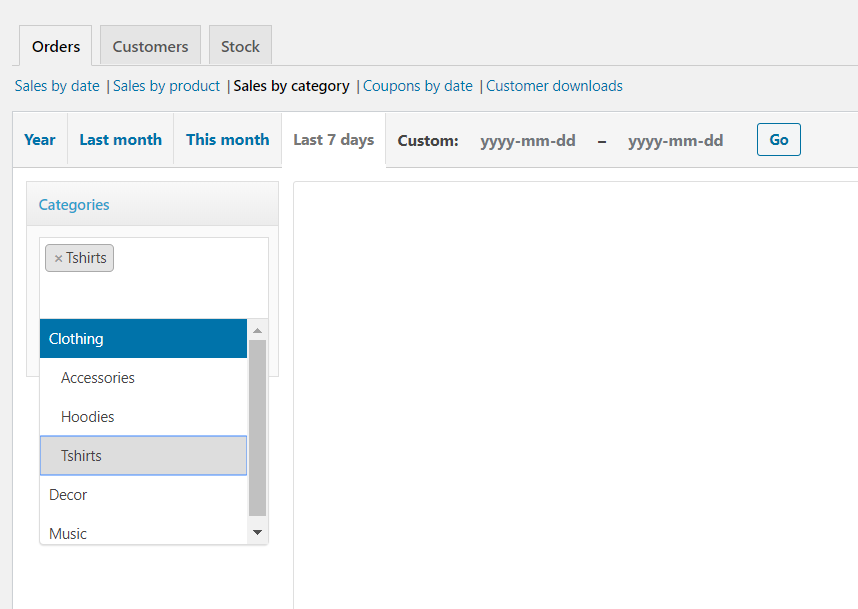
You can select as many categories as you want. Just click within the field to open the dropdown box. You can also delete them from the field by clicking the x next to its name. Click Show when you’re done making your selections.
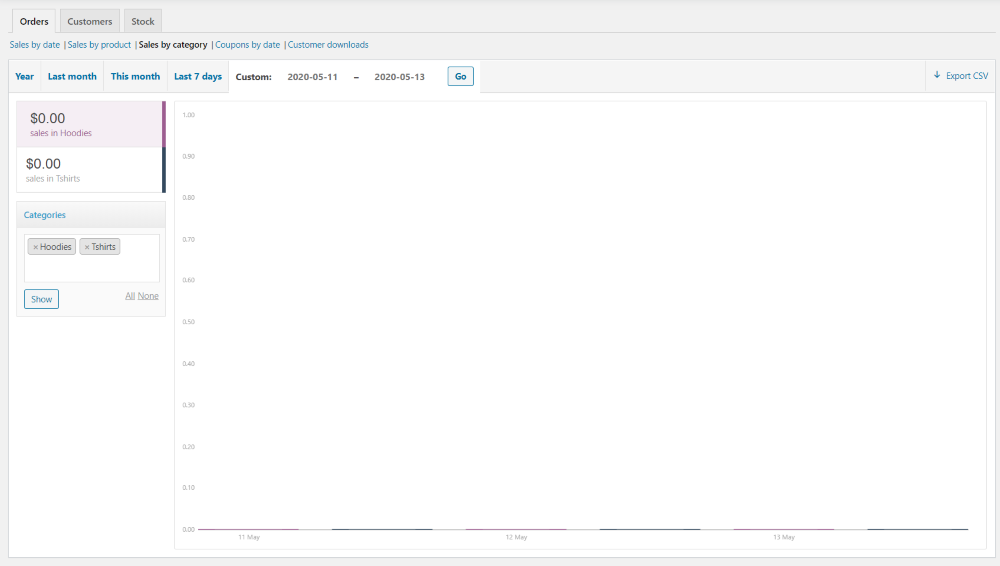
It lists their dollar amounts in the left sidebar and shows them on the graph. I created a coupon for my sample store, so all of my sales amounts are $0.00, but this would normally show an interactive graph that compares the sales figures for each of the categories.
Coupons by Date
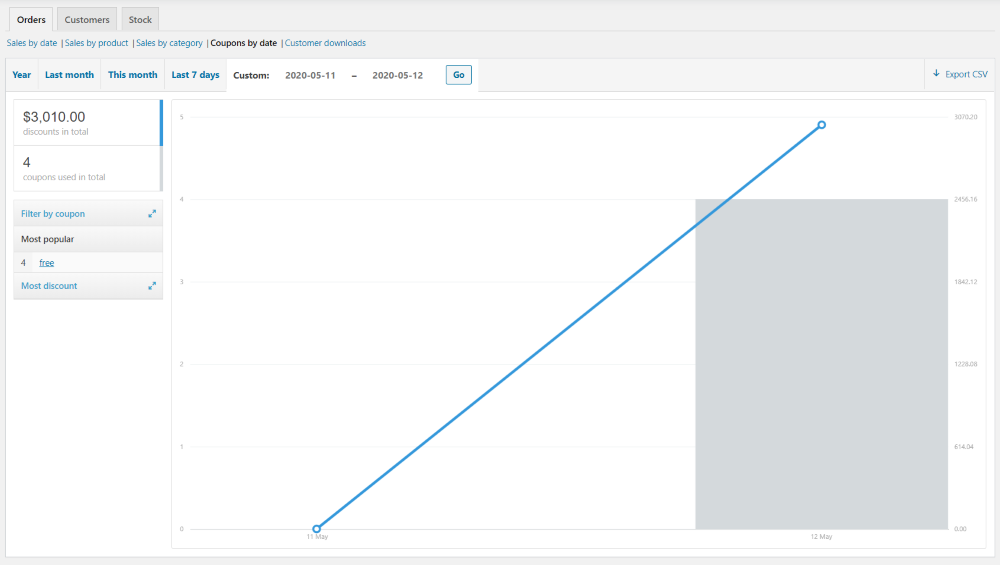
Coupons by date shows the amount of discounts for the date range you’ve selected, the number of coupons that were used during that time, and sorting features that let you search the coupons, see the most popular, and see the one with the most discounts.
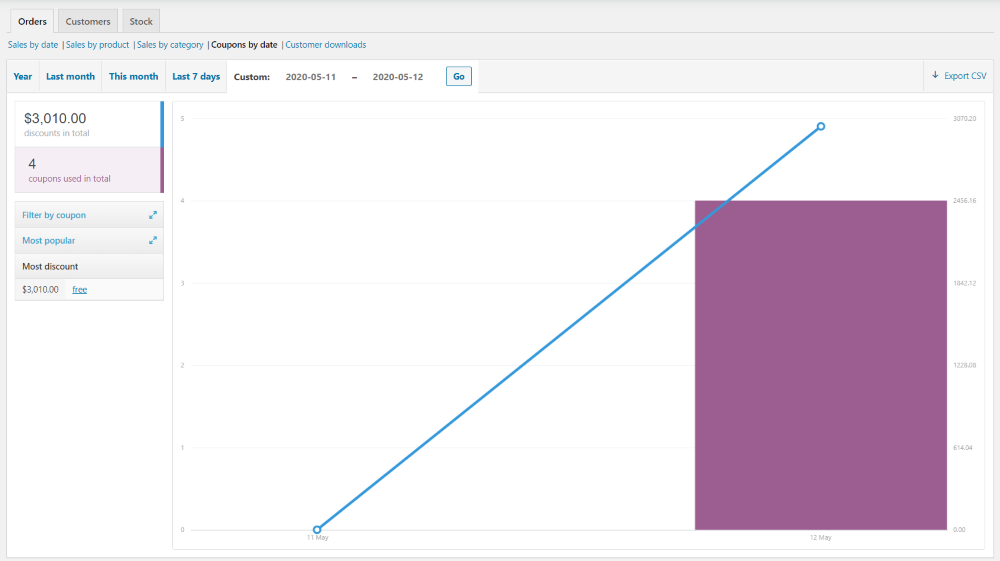
This chart is also interactive and it highlights the amounts and data points on hover.
Customer Downloads
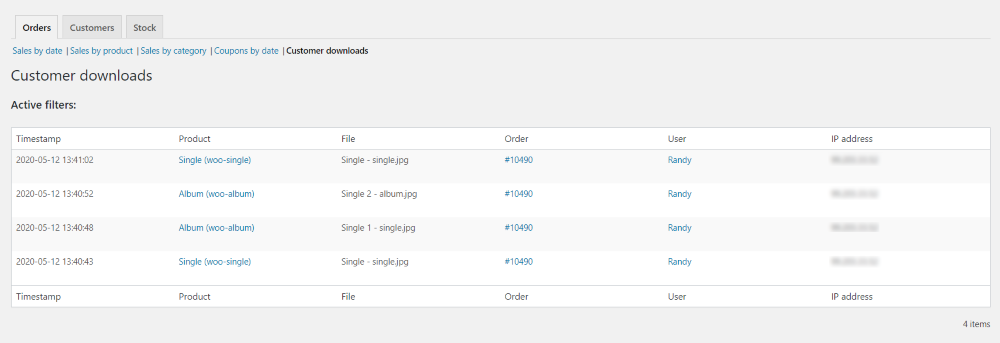
Customer downloads lists all downloads for all of the digital products. If a product was downloaded more than once it will appear on the list more than once. It shows the timestamp, product name, file name, order number, user name, and the user’s IP address.
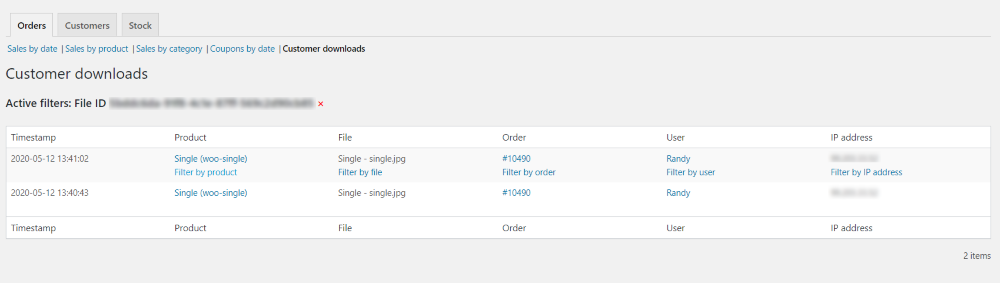
Hovering over them shows the different ways you can filter. You can filter with any of the headings except for the timestamp. In this example, I’ve filtered the results by clicking Filter by product.
More Advanced Reporting
The Orders reporting features of WooCommerce are simple and easy to use, but sometimes we need more advanced reporting features. One of the advantages of WooCommerce is that you can expand it with third-party plugins. This includes expansions for the orders reporting.
Aspen Grove Studios has several plugins that expand the orders reporting features of WooCommerce. Several are free and a few are premium. Here’s a quick look at each one.
Refund Reports for WooCommerce
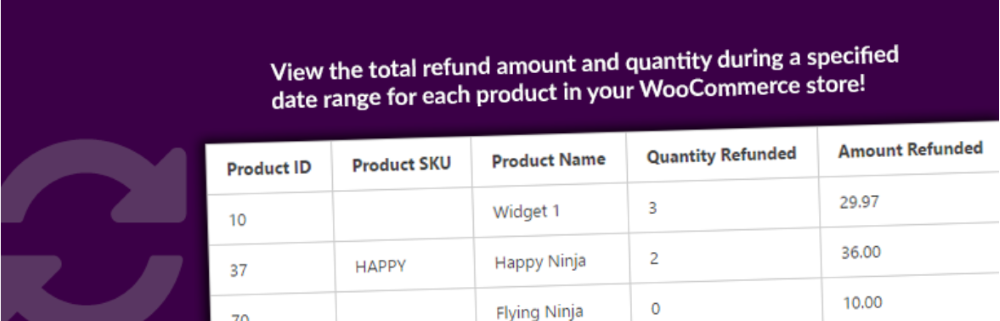
Refund Report for WooCommerce is a free plugin that lets you see which of your products have the most returns for a certain date range. View dates as a preset or as a custom date range. You can view all products or filter by category or product ID. You can also customize the sorting order by product ID, the quantity refunded, or the amount refunded.
Sales Trends for WooCommerce
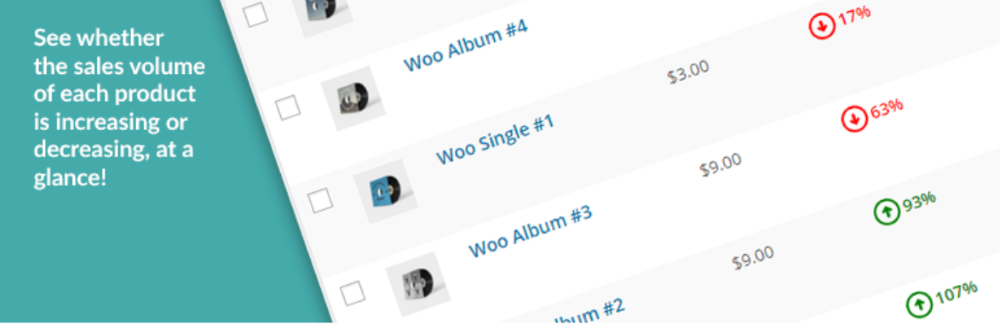
Sales Trends for WooCommerce is a free plugin that adds a column to the WooCommerce Products list that shows the percentage of change in the sales quantity for each product. It compares the current sales period to the previous period, which can be any number of days. It uses color-coded arrows so you can see the change at a glance. Clicking them opens a Sales by Product report for each product.
Product Sales Report

Product Sales Report for WooCommerce is a free plugin with a pro version available. It generates reports on the quantity and gross sales of products sold for a specific date range. The free version lets you view by date-range, filter by categories or product IDs, limit to certain order statuses, customize the sorting order, schedule to be sent by email, and embed the report in posts and pages using the Frontend Reports for WooCommerce add-on. Export the data as a CSV file.
Product Sales Report Pro for WooCommerce
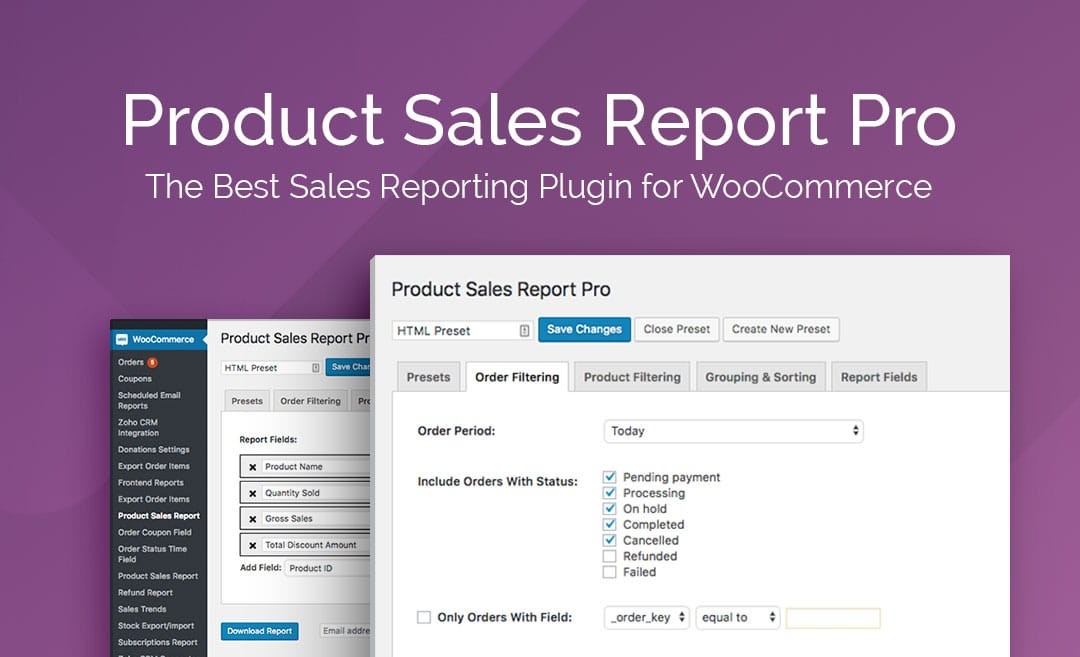
Product Sales Report Pro for WooCommerce is the pro version of the Product Sales Reports plugin. It lets you report on product variations individually, include products with no sales, report on shipping methods, limit to orders that match a custom meta field, change the names of the fields, change the order of the fields and columns, and include custom fields defined by WooCommerce or plugins associated with a product. Save with presets, export in Excel, and send as an email.
Export Order Items for WooCommerce
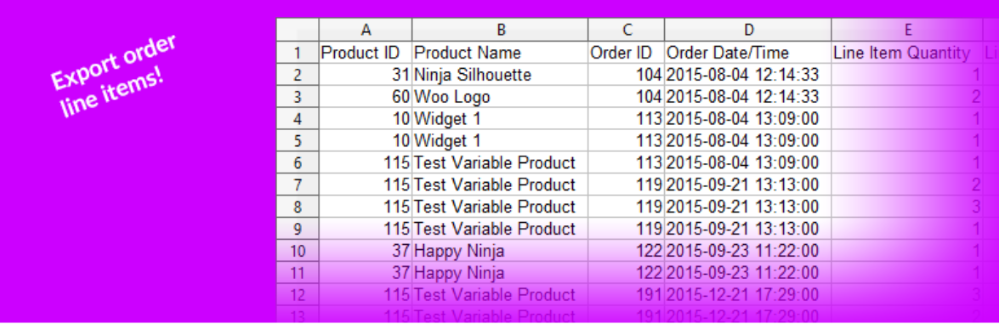
Export Order Items for WooCommerce generates a CSV spreadsheet that includes individual items sold during a specific date range. It has both a free and a pro version. The free version lets you use preset date-ranges or specify start and end dates, choose from 18 data fields, filter by status, schedule the export to be sent by email, and embed within pages and posts with the Frontend Reports for WooCommerce add-on.
Export Order Items Pro for WooCommerce
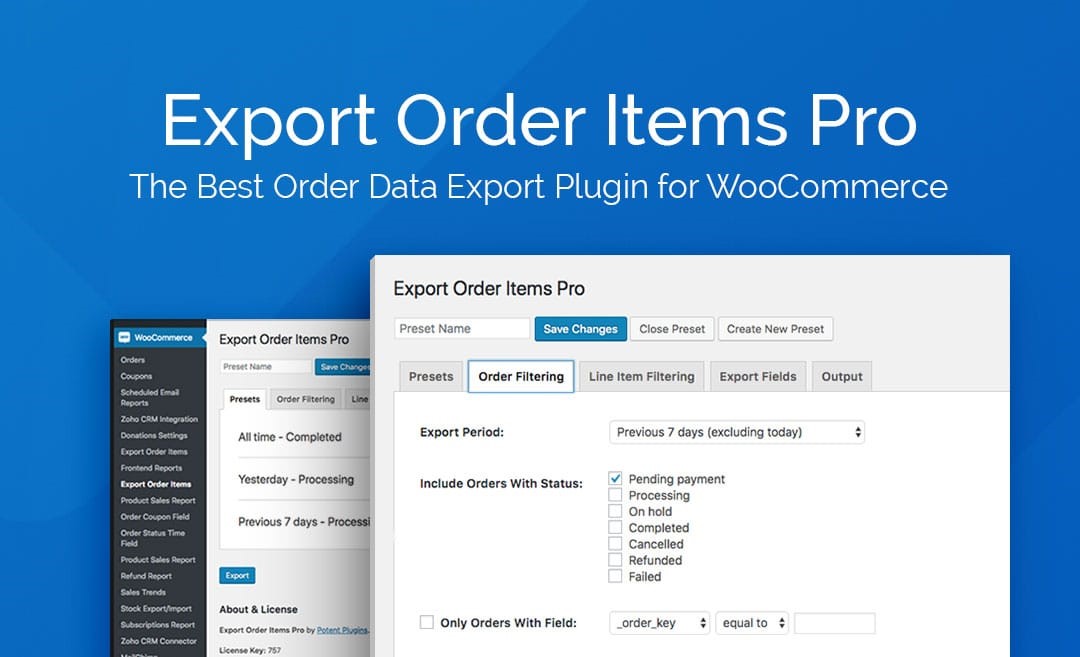
Export Order Items Pro for WooCommerce is the pro version of Export Order Items Pro. It lets you create multiple export presets, include product variations, include custom fields, limit by product IDs or categories, change the names and order of the fields, and export as Excel or HTML.
Frontend Reports for WooCommerce
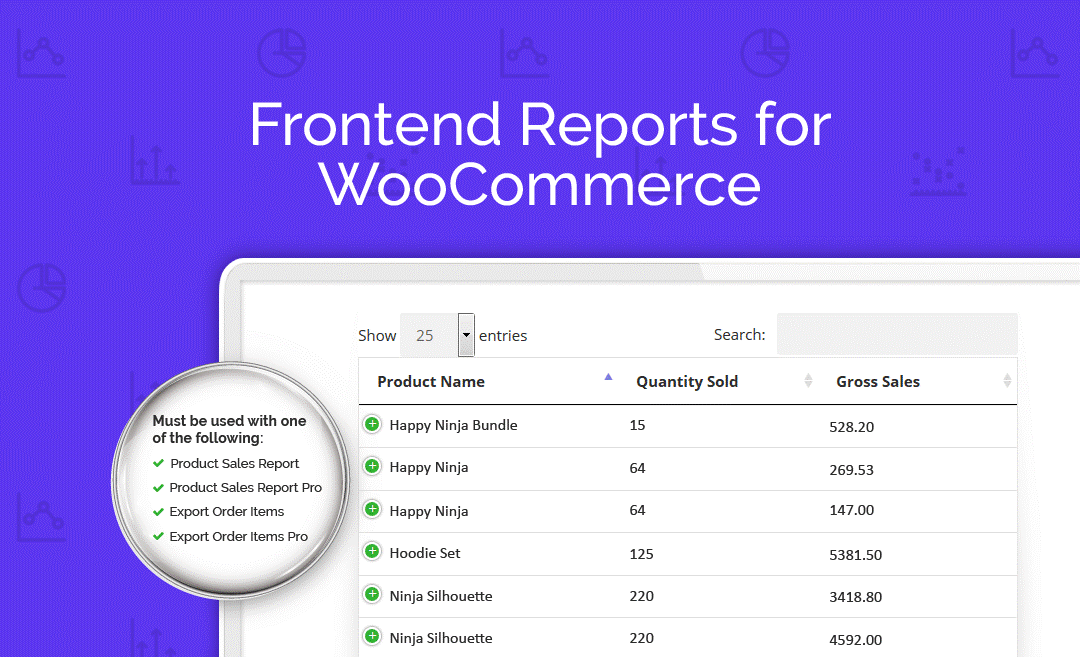
Frontend Reports for WooCommerce is a premium plugin that connects with Product Sales Report, Product Sales Report Pro, Export Order Items, and Export Order Items Pro plugins to present your reports on the front-end of your website. It provides the data within interactive tabs and includes sorting, searching, and download links. Display your reports within pages, posts, and widgets.
Ending Thoughts
That’s our look at the WooCommerce orders reports. WooCommerce does have some good reporting features and they’re easy to use. They provide some good basic information to help you keep up with your sales. If you want some deeper reporting tools for WooCommerce, be sure to check out the add-ons in the Aspen Grove Studios shop and WordPress depository.
We want to hear from you. Do you use WooCommerce orders reports? Let us know in the comments.
i agree with that
Sir I am using your plugin on my site for long now I want to purchase it for my another site which running on php 7.4, will it work on that site.
Hello, yes it should work with 7.4, although that version has reached end of life.
Sir I am using your plugin on my site for long now I want to purchase it for my another site which running on php 7.4, will it work on that site.